By André Blais and Eric Guntermann (Université de Montréal)
What is the story?
In this blog post, we systematically analyze the results of all the polls released between the last federal election (May 2011) and the beginning of the present campaign (end of July 2015) to assess the influence of events on parties’ levels of support since the last election. During these 51 months, the Conservatives were ahead (monthly average) 22 months, the Liberals 23 months, and the NDP six months. And it is the NDP that is leading at the beginning of the campaign.
What we did?
In the figures below, the solid lines show the evolution of monthly average vote intentions for the four largest national parties from May 2011 and July 2015.1 Each data point indicates the mean level of support for a given party in all the polls that were conducted in a particular month.
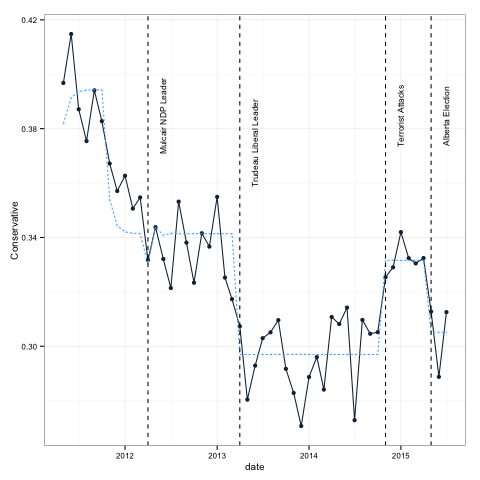
Figure 1 - Conservatives (click to enlarge)
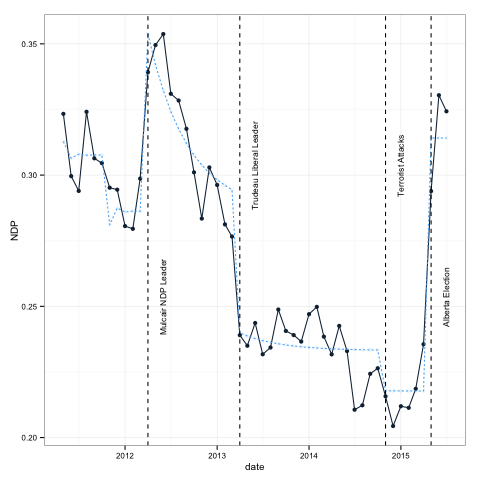
Figure 2 - NDP (click to enlarge)
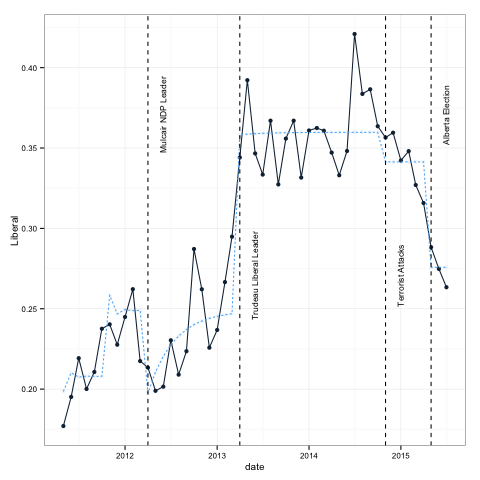
Figure 3 - Liberals (click to enlarge)
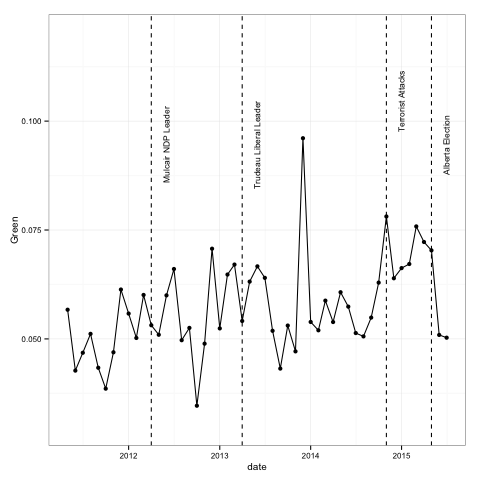
Figure 4 - Greens (click to enlarge)
We selected five such events and assess their impact on support for the Conservatives, the Liberals, and the NDP.2
The first event is a honeymoon following the election of the Conservative government in May 2011. Figure 1 shows that support for the Conservatives was particularly high right in the months following the election, and then declined quickly.
The second is the election of Thomas Mulcair as leader of the NDP, in March 2012. We see that the popularity of the NDP did increase after Mulcair’s election, although the change appears to have subsided rather quickly. The third event is the election of Justin Trudeau as leader of the Liberal party, in April 2013. His election was accompanied by a sharp growth in Liberal vote intentions, an impact that appears to have lasted for a good 18 months.
The last two events are the occurrence of terrorist attacks on Canadian soil in October 2014 and the stunning NDP victory in Alberta in May 2015. The former appears to have benefited the Conservatives while the latter was followed by a spectacular increase in NDP support across the country.3
In order to estimate the impact of these five events on vote intentions, we performed an ARIMA estimation.4 For each event we tested alternative models with permanent effects (that is, the variable equals 0 before the event and 1 afterwards) and temporary effects (that is, there is an immediate effect followed by a decay).5 We use the estimation with decay if it produces a better model fit and otherwise keep the more parsimonious model with a permanent effect. We estimated the same model for the three parties.
What we found?
The table below presents the estimated coefficients from ARIMA models. In the figures above, the dashed lines are the predicted values. For each event we tested alternative models with permanent effects (that is, the variable equals 0 before the event and 1 afterwards) and temporary effects (that is, there is an immediate effect followed by a decay). We use the estimation with decay if it produces a better model fit and otherwise keep the more parsimonious model with a permanent effect. We estimated the same model for the three parties.
| Conservative | Liberal | NDP | |
| Intercept | 0.34 | 0.25 | 0.29 |
| (0.00) | (0.01) | (0.01) | |
| Honeymoon | 0.04 | -0.05 | 0.03 |
| (0.01) | (0.02) | (0.01) | |
| Honeymoon AR(1) | 0.24 | -0.23 | -0.24 |
| (0.20) | (0.29) | (0.29) | |
| Mulcair becomes NDP leader | -0.01 | -0.05 | 0.07 |
| (0.01) | (0.02) | (0.01) | |
| Mulcair becomes NDP leader AR(1) | -0.23 | -0.75 | 0.83 |
| (0.64) | (0.11) | (0.04) | |
| Trudeau becomes liberal leader | -0.04 | 0.11 | -0.05 |
| (0.00) | (0.01) | (0.01) | |
| Terrorist attacks | 0.03 | -0.02 | -0.02 |
| (0.01) | (0.01) | (0.01) | |
| Alberta election | -0.03 | -0.07 | 0.10 |
| (0.01) | (0.02) | (0.01) | |
| AR(1) | 0.09 | 0.03 | 0.15 |
| (0.15) | (0.15) | (0.19) |
We find the following:
The Conservatives enjoyed a honeymoon effect that gave them a boost of about 4 points. The honeymoon seems to have lasted about 6 months and then rapidly disappeared. This boost seems to have been at the expense of the Liberals.
The election of Mulcair as the leader of the NDP gave that party an extra 7 points, mostly to the detriment of the Liberals. That gain, however, gradually dissipated and had essentially disappeared six months later.
The election of Trudeau at the helm of the Liberals increased Liberal support by 11 points, at the expense of both the Conservatives and NDP. The impact has been permanent.
The terrorist attacks were followed by a small Conservative gain of 3 points, to the detriment of both the Liberals and the NDP. The impact seems to have been permanent.
The NDP victory in Alberta produced a 10 point increase in NDP support, mostly at the expense of the Liberals. It is too early to say whether that effect is permanent or not.
Conclusion
In short, events make an important contribution to understanding over time variations in support for the three major national parties. The most important events have been the election of Mulcair and Trudeau as leaders of their parties and the NDP victory in Alberta.
MEDW members are conducting a thorough analysis of party and voter behaviour in the 2015 Canadian election. Professors Laura Stephenson, Andrea Lawlor, François Gélineau, Bill Cross, Elisabeth Gidengil, and André Blais are involved in this project. The tentative title of the book to be written is: Local/Provincial Battles, National Prize? Electoral Campaigns in a Federal State.
We thank Eric Grenier, creator of the ThreeHundredEight website for providing the data on vote intentions from May 2011 to May 2015, and Claire Durand, from the University of Montreal, for providing the data from May 2015 to July 2015. The month of each poll was identified on the basis of the median day of fieldwork. The percentages of support were computed on the basis of vote intentions for the five main parties (the Conservatives, the NDP, the Liberals, the Greens, and the Bloc). We excluded the ‘other’ category, which had different meanings in different surveys. There was only one survey in the month of July 2011. For that month we used that survey plus one that took place in late June (23/24). ↩
As we see in the Figure, support for the Greens hovers around 5% over the whole period. We did perform some estimations for Green support but none of the variables considered here came out significant. So, we do not show the result concerning this party here. In preliminary analyses we took into account the evolution of the unemployment rate but that variable never had a significant effect. ↩
For the Conservative honeymoon, the variable equals 1 during the first six months and 0 afterwards. For the Mulcair effect, we assume that the it took place in April rather than in March (he was elected on March 24). Similarly, the terrorist attack variable takes the value of 1 starting in November 2014 rather than in October (the attacks occurred on October 20 and 22). ↩
The time series are clearly non-stationary given that mean levels of support in the first half of the period are different from mean levels in the second half. A simple solution to ensure stationarity is to include a dummy variable that equals 1 after the election of Trudeau and 0 before. In order to make the errors white noise, we determined that an AR(1) component for the errors would be sufficient. Augmented Dickey Fuller tests as well as visual inspection confirm that the series are stationary once the Trudeau dummy is partialled out. ↩
We cannot test the presence of decay in the case of the Alberta election variable since it is too recent. ↩