The 2015 election in Spain

By Ignacio Lago

Universitat Pompeu Fabra, Barcelona

On December 20 2015 the twelfth national election after the restoration of democracy in the seventies was held in Spain. The election revolved around the consequences of the economic crisis, corruption and the relationship between Spain and Catalonia. The two national established parties, PP and PSOE, have been challenged by two new national parties, Podemos and Ciudadanos. As a result the Congress of Deputies in 2015 is the most fragmented we have seen since the II Republic in the thirties, the first democratic experience in Spain.

Four features make this election quite exceptional in the Spanish electoral history.

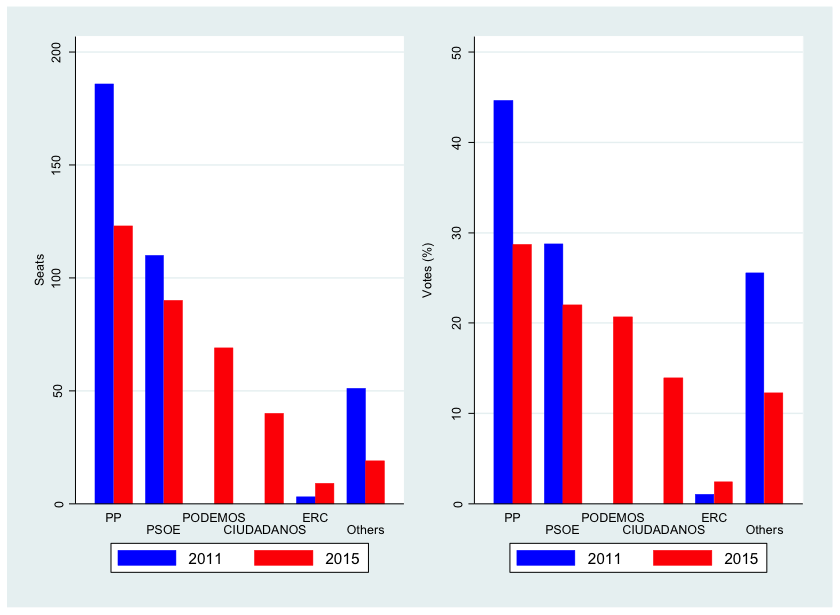
  • Despite winning the election, the ruling party, the center-right Partido Popular (Popular Party PP), has suffered the highest loss of support, 63 seats less than four years ago, since the disappearance of the UCD, the party which lead the democratic transition, in 1982. However, the Socialist Party (PSOE) has not taken advantage of this loss of support. It is again the main opposition party, but with only 90 seats, 20 less than in 2011, its worst-ever results.
  • The 29 percent of the votes and 123 (out of 350) seats won by PP in the 2015 election is the lowest support ever reached by the winner of a national election in Spain. In the previous eleven elections the number of seats got by the winner has fluctuated from 202 (in 1982) to 156 (in 1996) and then the selection of a Primer Minister (which demands majority in the first voting in the Parliament and plurality –more yes than no- in a hypothetical second voting) and the formation of a government has never been problematic: no coalition governments have been formed in Spain.
  • Two new parties, the far-left Podemos (We can) and the center-right Ciudadanos (Citizens), have very successfully entered the Parliament. In the electoral history before 2015, the most successful third party was the ex-communist Izquierda Unida (United Left) with 21 seats in 1996. In 2015 Podemos has got 69 seats and Ciudadanos 40. As a result, the support of the two main parties, the PP and the PSOE, the 51 percent of the votes (almost 25 points less than four years ago), is the lowest since the founding election in 1977.
  • For the first time in Spain the name of the future Prime Minister and the composition of the government is uncertain. The scenario is particularly open as there have been no positive coalition signals before the election, but negative. Only two options are on the table. An agreement or coalition between PP and PSOE or an agreement or a coalition between PSOE, Podemos, and subnational parties. In the former, the problem is that the platforms of the two parties are not closed; in the latter, the main problem is that Podemos is in favour of a referendum about the independence of Catalonia, while the PSOE is clearly against it.

If a Primer Minister is not elected before April …. There will be elections again!

Figure 1: Seats and votes in the 2011 and 2015 elections in Spain

Untitled

Posted in Blog | Comments closed

Are the better educated less cynical?

by Katherine Sullivan

What is the story?

This blog is about political cynicism, which is defined as a “mistrust generalized from particular leaders or political groups to the political process as a whole – a process perceived to corrupt the persons who participate in it and that draws corrupt persons as participants” by Capella and Jamieson (1997; 166). Cynicism is an important attitude that may explain lack of interest in politics and may adversely affect political participation.

I examine the relationship between education and cynicism. The hypothesis to be tested is that cynicism decreases with education (Agger, Goldstein & Pearl 1961). But more specifically I wish to determine whether the relationship is linear or not.

Data

I use surveys from the Making Electoral Democracy Work (MEDW) to examine the relationship between levels of education and cynicism during 6 regional and national elections in three democracies: Canada, France and Spain in 2011 and 2012.

Cynicism is measured with the survey item asking respondents to what extent they agree with the statement: “Politicians make campaign promises they have no intention of keeping”. Those who agree strongly are given a score of 1, those who agree somewhat a score of .66, those who disagree somewhat a score of .33 and those who disagree strongly a score of 0. The mean cynicism score in our pooled data set is 0.82.

Education is divided into three categories: the less educated, the moderately educated and the better educated. The first category ranges from “no schooling” to “completed high school”, the second from “college” to a “bachelor degree” and the third from a master’s degree and above. The overall percentages of less, moderately, and better educated in the pooled data set are 15%, 44% and 41% respectively.

Who is most cynical?

 Table 1. Levels of cynicism and education

Pooled

Canada Spain

France

Less educated

0.026*** 0.017 0.037* 0.005

Better educated

-0.027***

-0.052*** -0.001

-0.014

Gender

0.011* 0.010 0.007

0.017

Age

0.001**

0.001*** -0.001

0.001**

Cons

0.796***

0.780*** 0.828***

0.758***

N 5999 2236 1892

1871

*p<0.10 **p<0.05 ***p<0.01

Table 1 shows the findings of an OLS regression with the dependent variable being the respondent’s score on the cynicism variable. There are two education dummy variables for the less and the better educated (the reference category being the moderately educated). The findings support the hypothesis that cynicism decreases with education. This is particularly apparent in the pooled results, which merge results from all three democracies (Canada, France and Spain). The relationship however is weak, as the difference between the better and the less educated is only .05 on the 0 to 1 scale. Furthermore, the patterns vary across countries. Education has no impact in France while the only significant difference is between the better educated and all others in Canada and the less educated and all others in Spain.

Table 1 also shows a tiny gender effect of .01, women being slightly more cynical. Finally cynicism also increases with age, at least in Canada and France. The predicted cynicism score is .05 higher for someone who is 70 years old than for a 20 year-old respondent. The impact of age is about the same magnitude as that of education.

These results indicate that the most cynical citizens are the old and less educated, and the least cynical are the young and better-educated citizens.

Posted in Blog | Comments closed

Examining the Role of the Media in the 2015 Election Campaign

By Scott Pruysers

The Bell Chair in Canadian Parliamentary Democracy at Carleton University in association with Making Electoral Democracy Work sponsored a post election panel featuring Rosemary Barton (CBC), Susan Delacourt (Toronto Star), and Paul Wells (Maclean’s).

What was the panel about?

Moderated by Susan Harada, the panellists discussed a variety of topics including the role of social media, changing reporting techniques, the role and appropriateness of editorial endorsements, as well as their own personal experiences with the longest election campaign in modern Canadian history. Perhaps the most common theme of the night was a discussion of the challenges of covering modern election campaigns.

What were the challenges of covering this campaign?

Although all campaigns can be challenging to cover, the panel highlighted a variety of challenges specific to this campaign including a lack of resources and the costs associated with access to party leaders, the propensity for parties to bypass traditional (and national) media outlets, and a sometimes uneasy and antagonistic relationship between the media and political parties. It is worth briefly expanding on the first two of these challenges.

A lack of resources

While leaders tours are an essential part of the national campaign, they are costly affairs for those journalists seeking to travel with the party leader. At approximately $12,000 per week, cash-strapped media outlets are sending fewer and fewer journalists to cover these cross-country tours. Global news, for example, chose not to have a journalist on the tour. While each panellist agreed that being on the tour provides greater access and coverage, Susan Delacourt suggested that the business model simply no longer works. In fact, Delacourt predicted that journalists would find alternate methods of covering the leaders in the future.

Bypassing the national media

Perhaps more troubling for the panel was a sense that political parties are increasingly attempting to bypass the national media in favour of local, regional, and ethnic media outlets. As parties use regionalized campaign tactics and sophisticated voter targeting techniques, tailoring messages for regional and local markets is a key component of their campaign strategy. This is made more challenging for national media outlets as parties continue to bypass the media more generally, transmitting messages and videos directly to voters on social media such as Facebook and Twitter.

Overall the event was a great success. More than 200 audience members attended the panel and a number of audience members participated in an engaging Q&A at the end. Online and social media reaction to the panel was positive as a number of members of the audience tweeted additional comments and questions to the presenters during and after the event. In fact, many stayed for a small reception afterwards in hopes of taking a picture with the celebrity-like panellists.


Posted in Blog | Comments closed

What are voters listening to during an electoral campaign?

By Katherine V. R. Sullivan (Université de Montréal)

What is the story?

There is a consensus that voters are politically uninformed, which can have repercussions on their decisions. Indeed, their vote choice may or may not be a true reflection of their values, opinions and beliefs. Regardless, there are many sources of information during an electoral campaign that may help reduce the informational gap. With the ever-rising popularity and accessibility of digital tools, there is considerable debate on the potential of new media vs traditional media.

On one hand, the new media allow users instant access to multiple sources of information, lower physical barriers and provide a digital public sphere where citizens, journalists and politicians alike can discuss. On the other hand, Internet may simply be a new playing ground for spin-doctors, greater polarization of opinions and digital echo chambers.

Data

Data from the Making Electoral Democracy Work (MEDW) surveys can provide useful insights on this question. Hence, I have analysed data from the 2012 provincial elections in the province of Quebec and the Ontario 2011 election in order to determine what types of media were most used by Canadian voters to acquire political information during the election.

Media types were divided into two categories: new media and traditional media. By new media, we mean Internet and Twitter. The traditional media are the radio, television and newspapers.

What’s popular? What’s not?

Figure 1. Media types as sources of political information

figureMEDW

Note: Respondents were asked to rate their use of different types of media on a scale from 0 to 1.

As is shown in figure 1, television was by far the most popular media during the two provincial elections. Indeed, Canadian voters preferred traditional media, such as television and newspapers, to Twitter. However, results show that the Internet was a more popular source of political information than the radio.

Table 1. Media use and socio-demographic characteristics

Internet Twitter TV Radio Newspaper
Age -0.12* -0.07* 0.14* 0.04* 0.09*
Female -0.09* -0.02* -0.01 -0.05* -0.09*
Education 0.09* 0.02 0.05* 0.09* 0.08*
Ontario -0.10* -0.05* -0.16* -0.06* -0.06*
R2 0.08 0.05 0.07 0.03 0.06*
Constant 0.53 0.14 0.53 0.30 0.38
N 1591 1571 1600 1593 1595

Note: OLS regression. The dependant variable is media consumption of political information (0 to1 scale). The independent variables are all dichotomised, Values of 1 indicate older than 35, female, and post-secondary education.

* p<.05

Table 1 shows the relationship between the use of the various media and age, education, gender, as well as the differences between the provinces of Ontario and Quebec. We see, as expected, that younger respondents are more prone to use the internet and twitter while the reverse holds for the traditional media. The level of education is also significant in the choice of media. Canadian voters with higher levels of education – post-secondary education in this case – prefer the Internet, radio and newspapers. Finally women tend to make less use of all media sources, both new and traditional.

There is also a discernable difference in media consumption between the two provinces as is shown by the Ontario variable. Quebeckers are more intensive users of all media, both new and old, an indication that they were more interested in general in the provincial election, as indicated by a higher turnout.

Overall, although the Internet holds great promise for access to information and political leaders, it has yet to reach as great an audience as traditional media such as television and newspapers. We see, however, that there is a big age gap in the use of digital and traditional media, and so among youth the Internet has become as important as TV. There is also an educational cleavage, with the better educated making greater use of the internet but that cleavage is very similar to that found in the case of radio and newspaper. The same verdict applies to the gender gap: women make less use of all media. In short, those who use the internet are also those who use the traditional media, with the exception of the young, for whom the internet is becoming a very important source of information.


Posted in Blog | Comments closed

Which electoral system citizens prefer and why?

What is the story?

These last 25 years, 20 referendums have been organized on whether the current set of voting rules should be replaced or not. Some of these referendums took place in long-standing and democracies such as the United Kingdom in 2011.

In a recent paper accepted for publication in Public Choice, we use an original online voting experiment to examine which system citizens prefer. We also study the factors that influence this preference.

The online voting experiment

A few weeks before the first round of the 2012 French Presidential election, we released an interactive website: www.voteaupluriel.org. The website was open to all, but we used French national media to advertise it. In total, more than 5,000 eligible French citizens participated in our experiment and fully completed the protocol.

During our online experiment, we invited participants to report how they intended to vote for the upcoming election using the actual two-round majority system. Then we asked them how they would vote under three alternative voting rules:

  • One-round plurality: the candidate with the most votes is elected
  • Alternative voting: voters rank order the candidates and the candidates with a majority of first preferences wins (the weakest candidates are subsequently eliminated and their vote reported to the other candidates until one obtains a majority of first preferences)
  • Approval voting: voters indicate all the candidates that they approve and the candidate with the most votes (approvals) wins

Results

At the end of our experiment we asked participants which set of voting rules they prefer. The results indicate that they prefer alternative voting (41%), to approval voting (27%), two-round majority (24%), and one-round plurality (8%). See the table below.

We find that citizens tend to prefer the system that is most favourable to their most preferred candidate. Participants whose preferred candidate was among the top two contenders of two-round majority system (Hollande and Sarkozy) had 20% more chances of preferring this electoral system. See the table below.

(click to enlarge)

(click to enlarge)

We also find that (1) participants dislike voting rules if they vote strategically, i.e. desert their most preferred candidate as this candidate has no chance of winning, and (2) left-wing citizens prefer systems under which they can vote for several candidates (alternative and approval voting) while right-wing citizens prefer one-round plurality and two-round majority.

For more details see, André Blais, Jean-François Laslier, François Poinas, and Karine Van der Straeten. Forthcoming. Citizens’ preferences about voting rules: self-interest, ideology, and sincerity. Public Choice.

Posted in Blog | Comments closed

The Ups and Downs of Party Support in Canada: 2011-2015

By André Blais and Eric Guntermann (Université de Montréal)

What is the story?

In this blog post, we systematically analyze the results of all the polls released between the last federal election (May 2011) and the beginning of the present campaign (end of July 2015) to assess the influence of events on parties’ levels of support since the last election. During these 51 months, the Conservatives were ahead (monthly average) 22 months, the Liberals 23 months, and the NDP six months. And it is the NDP that is leading at the beginning of the campaign.

What we did?

In the figures below, the solid lines show the evolution of monthly average vote intentions for the four largest national parties from May 2011 and July 2015.1 Each data point indicates the mean level of support for a given party in all the polls that were conducted in a particular month.

Conservatives (click to enlarge)

Figure 1 - Conservatives (click to enlarge)

NDP (click to enlarge)

Figure 2 - NDP (click to enlarge)

Liberals (click to enlarge)

Figure 3 - Liberals (click to enlarge)

Greens (click to enlarge)

Figure 4 - Greens (click to enlarge)

We selected five such events and assess their impact on support for the Conservatives, the Liberals, and the NDP.2

The first event is a honeymoon following the election of the Conservative government in May 2011. Figure 1 shows that support for the Conservatives was particularly high right in the months following the election, and then declined quickly.

The second is the election of Thomas Mulcair as leader of the NDP, in March 2012. We see that the popularity of the NDP did increase after Mulcair’s election, although the change appears to have subsided rather quickly. The third event is the election of Justin Trudeau as leader of the Liberal party, in April 2013. His election was accompanied by a sharp growth in Liberal vote intentions, an impact that appears to have lasted for a good 18 months.

The last two events are the occurrence of terrorist attacks on Canadian soil in October 2014 and the stunning NDP victory in Alberta in May 2015. The former appears to have benefited the Conservatives while the latter was followed by a spectacular increase in NDP support across the country.3

In order to estimate the impact of these five events on vote intentions, we performed an ARIMA estimation.4 For each event we tested alternative models with permanent effects (that is, the variable equals 0 before the event and 1 afterwards) and temporary effects (that is, there is an immediate effect followed by a decay).5 We use the estimation with decay if it produces a better model fit and otherwise keep the more parsimonious model with a permanent effect. We estimated the same model for the three parties.

What we found?

The table below presents the estimated coefficients from ARIMA models. In the figures above, the dashed lines are the predicted values. For each event we tested alternative models with permanent effects (that is, the variable equals 0 before the event and 1 afterwards) and temporary effects (that is, there is an immediate effect followed by a decay). We use the estimation with decay if it produces a better model fit and otherwise keep the more parsimonious model with a permanent effect. We estimated the same model for the three parties.

Conservative Liberal NDP
Intercept 0.34 0.25 0.29
(0.00) (0.01) (0.01)
Honeymoon 0.04 -0.05 0.03
(0.01) (0.02) (0.01)
Honeymoon AR(1) 0.24 -0.23 -0.24
(0.20) (0.29) (0.29)
Mulcair becomes NDP leader -0.01 -0.05 0.07
(0.01) (0.02) (0.01)
Mulcair becomes NDP leader AR(1) -0.23 -0.75 0.83
(0.64) (0.11) (0.04)
Trudeau becomes liberal leader -0.04 0.11 -0.05
(0.00) (0.01) (0.01)
Terrorist attacks 0.03 -0.02 -0.02
(0.01) (0.01) (0.01)
Alberta election -0.03 -0.07 0.10
(0.01) (0.02) (0.01)
AR(1) 0.09 0.03 0.15
(0.15) (0.15) (0.19)

We find the following:

The Conservatives enjoyed a honeymoon effect that gave them a boost of about 4 points. The honeymoon seems to have lasted about 6 months and then rapidly disappeared. This boost seems to have been at the expense of the Liberals.

The election of Mulcair as the leader of the NDP gave that party an extra 7 points, mostly to the detriment of the Liberals. That gain, however, gradually dissipated and had essentially disappeared six months later.

The election of Trudeau at the helm of the Liberals increased Liberal support by 11 points, at the expense of both the Conservatives and NDP. The impact has been permanent.

The terrorist attacks were followed by a small Conservative gain of 3 points, to the detriment of both the Liberals and the NDP. The impact seems to have been permanent.

The NDP victory in Alberta produced a 10 point increase in NDP support, mostly at the expense of the Liberals. It is too early to say whether that effect is permanent or not.

Conclusion

In short, events make an important contribution to understanding over time variations in support for the three major national parties. The most important events have been the election of Mulcair and Trudeau as leaders of their parties and the NDP victory in Alberta.

MEDW members are conducting a thorough analysis of party and voter behaviour in the 2015 Canadian election. Professors Laura Stephenson, Andrea Lawlor, François Gélineau, Bill Cross, Elisabeth Gidengil, and André Blais are involved in this project. The tentative title of the book to be written is: Local/Provincial Battles, National Prize? Electoral Campaigns in a Federal State.


  1. We thank Eric Grenier, creator of the ThreeHundredEight website for providing the data on vote intentions from May 2011 to May 2015, and Claire Durand, from the University of Montreal, for providing the data from May 2015 to July 2015. The month of each poll was identified on the basis of the median day of fieldwork. The percentages of support were computed on the basis of vote intentions for the five main parties (the Conservatives, the NDP, the Liberals, the Greens, and the Bloc). We excluded the ‘other’ category, which had different meanings in different surveys. There was only one survey in the month of July 2011. For that month we used that survey plus one that took place in late June (23/24). 

  2. As we see in the Figure, support for the Greens hovers around 5% over the whole period. We did perform some estimations for Green support but none of the variables considered here came out significant. So, we do not show the result concerning this party here. In preliminary analyses we took into account the evolution of the unemployment rate but that variable never had a significant effect. 

  3. For the Conservative honeymoon, the variable equals 1 during the first six months and 0 afterwards. For the Mulcair effect, we assume that the it took place in April rather than in March (he was elected on March 24). Similarly, the terrorist attack variable takes the value of 1 starting in November 2014 rather than in October (the attacks occurred on October 20 and 22). 

  4. The time series are clearly non-stationary given that mean levels of support in the first half of the period are different from mean levels in the second half. A simple solution to ensure stationarity is to include a dummy variable that equals 1 after the election of Trudeau and 0 before. In order to make the errors white noise, we determined that an AR(1) component for the errors would be sufficient. Augmented Dickey Fuller tests as well as visual inspection confirm that the series are stationary once the Trudeau dummy is partialled out. 

  5. We cannot test the presence of decay in the case of the Alberta election variable since it is too recent. 

Posted in Blog | Comments closed

The Importance of Three Ideological Dimensions

Mike Medeiros, McGill University
Jean-Philippe Gauvin, University of Montreal
Chris Chhim, McGill University

What is the story?

Politics in regions or countries with a salient ethno-regionalist cleavage take on a unique dynamic. In addition to ideological positioning on economic and social stances, centre-periphery issues add a third ideological dimension that needs to be considered for grasping the complexity of vote choice. Yet, electoral research has rarely given appropriate attention to these three ideological dimensions independently.

In a forthcoming paper in Electoral Studies, we take up this challenge by presenting a three-dimensional ideological model of vote choice. We theorise that the three ideological dimensions have a determining and independent influence on voting in ethno-regional political contexts.

Data

We use pre- and post-election panel surveys from the Making Electoral Democracy Work (MEDW) for the September 2012 Quebec and November 2012 Catalan elections. The three ideological dimensions are captured by creating summative rating scales based on survey questions. While vote intentions are taken from post-electoral questions, controls and main predictors come from the pre-electoral wave of the survey.

Results

The findings support our theoretical assumption. Figure 1 (Quebec) and Figure 2 (Catalonia) illustrate the analytical necessity of presenting the positions of party supporters across the three dimensions. The figures, supported by independent sample t-tests, demonstrate that electors for specific parties in both regions tend to be grouped in different parts of the three-dimensional space.

Positioning

Positioning of Quebec Voters by Party

Positioning of Catalan Voters by Party

Positioning of Catalan Voters by Party

Furthermore, multinomial logistic regressions, with a series of control variables (age, gender, education, income, political interest, and mother tongue), were used to measure the dimensions’ specific influence on the vote for the four major parties in each region. The results clearly show that the three dimensions were distinct determinants of vote choice for the 2012 sub-national elections in Catalonia and Quebec.

Conclusion

As these data show, economic and social dimensions are not necessarily congruent and must be taken into account separately. It does not necessarily follow that voters who are more socially conservative are also economically conservative. Thus, while previous studies of electoral behaviour in ethno-regional contexts have included the centre-periphery axis, we propose that including this factor should not come at the expense of not considering the importance of the ‘traditional’ economic and social dimensions in structuring political outcomes.

We recommend employing our three-dimensional vote choice model to other party systems divided along the centre-periphery dimension, such as Scotland, Belgium and Bavaria, but also to cases not necessarily structured along this axis but that have been shown to have regions where centre-periphery issues are meaningful, such as Australia and the United States.

Posted in Blog | Comments closed

MAPP: New Resources on Party Affiliation

Emilie van Haute, Université libre de Bruxelles

What is MAPP and what we do?

MAPP is a working group on Members and Activists of Political Parties. It brings together international scholars interested in the topics of party affiliation, membership and activism. Launched in May 2014, MAPP is also a 3-year research project aimed at ‘understanding the dynamics of party membership’, and funded by the Belgian Fonds national de la recherche scientifique (FRS-FNRS).

The project intends to look at party affiliation as a relationship between supply and demand, between affiliates and their party organization, in a dynamic perspective. We realized that this relationship is not well understood. Too often, parties are considered as disincarnate organizations, or individual members are considered independent of the party they belong to. This is mainly due to the lack of available comparative data on the topic. The project intends to provide this comparative data.

How far are we?

As for Phase 1 (completed), we have undertaken a huge archival work. We have summarized what exists in terms of surveys of party members and activists, and we have archived the survey questionnaires and/or data. It has also lead to the publication of an edited volume with Routledge (Van Haute E., Gauja A. (eds) (2015), Party Members and Activists. London: Routledge). The volume summarizes where we stand and what we know about membership and activism today. It provides a clear picture of who joins political parties, why they do it, the character of their political activism, how they engage with their parties, and what opinion they hold.

Also, we have gathered longitudinal data on party membership for no less than 397 parties in 31 countries. These data allow going beyond national aggregates of party membership. It also allows testing for alternative explanations of party membership fluctuations over time, beyond the traditional macro- and micro-level perspectives. Particularly, party level explanations can be investigated, which will allow to test whether parties can do anything about these fluctuations or whether they are powerless towards their membership levels.

For example, we have calculated the ratios of members/voting age population (M/E) for each party. The figure below displays the average ratios by party family per decade since 1950 (see the figure below, click to enlarge). Significant differences appear. While a general declining trend of party membership is clearly observable, some party families seem to have coped slightly better than others. Indeed, the Conservatives display a lower rate of decline than the Social Democrats. Furthermore, the membership decline among the Social Democrats has slowed down in the last decades. Other party families such as the Christian Democrats and Liberals have faced a slower, non-linear decline, while the Greens have increased their average M/E in the last decades.

vanhaute1

All these data are available on the project website.

What’s next?

Phases 2 and 3 of the MAPP project are based on a comparative analysis of parliamentary parties in 10 countries where experts have previous successful experiences with (online) surveys of party members. The data collection will comprise a local branch survey on the recruitment, management, and retention of party affiliates, as well as a survey of party affiliates (members and, where applicable, supporters). These surveys will allow to better grasp the dynamics of party affiliation, understood as a relation between affiliates and their party.

Posted in Blog | Comments closed

How do people react to the ‘performance’ of the party they voted for?

By Shane P. Singh, University of Georgia

Note: an extended version of this blog post appeared earlier at Democratic Audit UK

What is the story?

On Election Day, vote shares translate into seats and power in accordance with the electoral rules. In the end, some parties perform well, others do not, and a new government is formed. In the days or weeks following the election, it is not uncommon to see supporters of the parties in power express satisfaction with the democratic process, while those whose voices remain unrepresented in government express their disappointment.

In a paper forthcoming in Party Politics, we examine how the performance of the party one voted for affects his or her degree of satisfaction with the way democracy works. Our goals are (a) to determine whether those whose party performed well in the election become more satisfied with democracy after the election and (b) to shed light on which aspects of party performance matter most.

Data

We use 13 panel election studies that were conducted for the Making Electoral Democracy Work project. Each study was run between 2011 and 2013, and the surveys encompass ten regions within five countries: Canada, France, Spain, Germany, and Switzerland. The surveys each include two waves, usually with about 1,000 persons responding to the pre-election questionnaire in the last two weeks of the campaign and about 800 of them responding to the post-election questionnaire immediately after the election.

Both waves include a question asking respondents how satisfied they are with the way democracy works in their region or country (depending on the type of election). Since we have measures of satisfaction just before and after the election, we are quite confident that any changes observed between the two waves can be attributed to the election outcome rather than some other unobserved factor(s).

Results

We find, without much surprise, that people who voted for parties that were more successful in terms of votes or legislative seats became more satisfied with democracy. But, taking our analyses a step further, we also observe that those who voted for parties that received many votes but few seats—that is, parties that were underrepresented in parliament—became more dissatisfied. This is illustrated in the below figure.

singh2

Conclusions

A number of interpretations and predictions can be drawn from our results. For example, we find that satisfaction with democracy is sensitive to representation biases introduced by the electoral system. Indeed, satisfaction with democracy can decrease when a voter supports a party that turns out to be underrepresented in the legislature, as compared to the proportion of votes it obtained. This suggests that voters are more satisfied—or at least less dissatisfied—when seats are proportional to votes.

Yet, our findings also present a challenge to this interpretation. Our analyses show that voters do not show the same dissatisfaction when representation biases lean in their favor. On the contrary, our models suggest that, if two parties were to obtain the same share of votes but a different share of seats, those voters who supported the advantaged party would experience a bigger increase in satisfaction. In short, voters’ reactions to representation biases depend on whether their party is advantaged or disadvantaged in a quite predictable way.

For further details, see André Blais, Alexandre Morin-Chassé, and Shane P. Singh. Forthcoming. Election outcomes, legislative representation, and satisfaction with democracy. Party Politics.

Posted in Blog | Comments closed

Strategic voting in Quebec: an analysis of the 2012 provincial election

By Jean-François Daoust, University of Montreal

What is the story?

Despite the fact that the Quebec mass media often refer to strategic voting in their coverage of provincial elections, there is, to date, no research on that topic that specifically focuses on Quebec provincial elections. In a recently accepted article, I filled this gap in analyzing the 2012 Quebec provincial election survey of the Making Electoral Democracy Work project. First, I examined the extent to which voters engage in strategic behaviour; second, I analyzed the individual factors that influence their proclivity to cast a strategic vote.

How many strategic voters?

I followed a classic approach. In a first step I identified the survey respondents that could have potentially casted a strategic vote, that is, those whose preferred party was not one of the top two contenders in their district. These respondents had incentives to desert their preferred party and to cast a vote for one of the two viable parties in order to increase their chances to affect the final electoral outcome. 34% of respondents were potential strategic voters.

Then, I calculated the proportion of potential strategic voters that deserted their preferred party and voted for another one. They were 18%. Finally, I checked the proportion of those deserters that voted for their preferred party between the top two contenders in the district. These were strategic voters and they represented 8% of the whole sample. Table 1 shows, step-by-step, how I ended up having 8% of strategic voters.

Potential strategic voters Proportion of deserting potential strategic voters Proportion of strategic voters
34% 17.8% 8.4%
Table 1. Strategic voters in Quebec

The determinants of strategic voting

To answer the second research question, I looked at the determinants of strategic voting. Table 2 reports the results of a logistic model predicting the probability of casting a strategic vote. I found that partisanship and the intensity of party preference have a strong negative effect on the proclivity of casting a strategic vote. However, contrary to what I expected, sophisticated voters do not seem to act more strategically than the less sophisticated

Standardized coefficient (std. error)
Political sophistication -0.37 (1.16)
Party preference’s intensity -3.30** (1.25)
Partisanship -0.72* (0.41)
Constant -2.27** (0.99)
Pseudo R2 0.06
N 425
Table 2: Determinants of strategic voting (** p <0.05; * p < 0.10 )

Conclusion

My article is the first academic research on strategic voting in a provincial election in Canada. I provided a first systematic account of this behaviour in Quebec.

For further details, see Jean-François Daoust. Forthcoming. Vote stratégique au Québec: Analyse de l’élection de 2012. Politique et sociétés.

Posted in Blog | Comments closed