Will PEI change its electoral system?

By Katherine V.R. Sullivan, Université de Montréal

What’s the story?

Prince Edward Island is inviting Islanders to take part in an electoral reform plebiscite over a 10-day period between October 29th and November 7th. This extraordinary plebiscite will not only ask citizens to express their preferences about five different electoral systems, it will also allow them to express their preferences, either by traditional paper ballot, by telephone or electronically, using a government issued PIN. Furthermore, all citizens aged 16 or older will be eligible to vote.

The following question will be on the ballot:

“Rank the following electoral system options in your order of preference, 1 through 5 (with 1 being your most preferred and 5 being you least preferred)”.

The 5 options

First-past-the-post

This is the current electoral system, which involves single-member districts. This means that each voter casts a ballot for one candidate. The candidate having received the most votes in each district is elected.

First-past-the-post plus leaders

FPTP+ is similar to the status quo, but with the addition of a seat awarded to a leader whose party obtains a threshold of 10% of the provincial vote.

Preferential voting

This electoral system is used in Australia (lower house) and involves single-member districts. Voters are asked to rank the candidates according to preference. A candidate must then obtain an absolute majority of the votes in order to be elected. If no candidate has a majority, the candidate ranked last is eliminated and that candidate’s votes are redistributed to the other candidates on the basis of voters’ second preference votes. The process continues until a candidate has a majority of the votes and is elected.

 Dual Member Proportional

 DMP has two-member districts. Each party presents two candidates (primary and secondary) and voters elect a party. The first half of the seats goes to the primary candidate of the party with most votes in each district. After this is done, the number of seats each party “deserves” is computed, the total number corresponding to its share of the vote in the whole province. The number of remaining seats each party should get, which is the total number of seats it “deserves” according to the proportionality rule minus those won in the districts is then calculated. These remaining seats are allocated to the best performing candidates within each party. This should result in candidates from two different parties being elected in most (two member) districts.

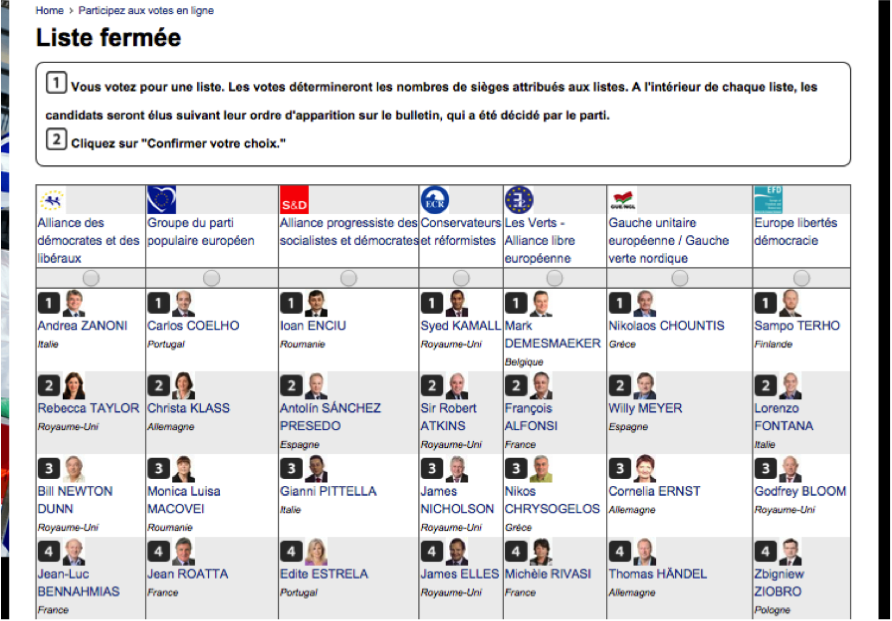
Mixed Member Proportional

Finally, MMP is an electoral system used in Germany, New Zealand and Scotland, which gives voters two votes. The first vote is for a candidate in their single-member district and the second is for a party list within the entire province. The candidate with the most votes is elected in each district. After this is done, the number of seats each party “deserves” is computed, that total number corresponding to its share of the vote in the whole province. The number of remaining seats each party should get is then determined, which is the total number of seats it “deserves” according to the proportionality rule minus those won in the districts. These remaining seats are allocated to the candidates that are the top of the party lists. There are thus two types of elected candidates, those who represent specific districts and those who represent the whole province.

Why this matters

PEI’s plebiscite is important as it could lead to a change in the voting system in that province. Furthermore, this could affect the electoral reform debate that has been ongoing at the federal level. Finally, it may also spark a debate over voting age and online voting in Canada.

For more information on PEI’s voting-reform plebiscite, feel free to consult Elections Prince Edward Island’s website.

Posted in Blog | Comments closed

Correct voting and post-election regret

By

André Blais

Université de Montréal

Anja Kilibarda

Columbia University

What’s the story?

Elections are often seen as a way for citizens to communicate their views. However, much research has shown that many voters are not well informed about the issues of the day. This raises the question whether some people make the wrong choice. That is, whether some may vote in a way that does not best reflect their interests and values and thus regret their decision after the fact.

This possibility has been discussed extensively in the aftermath of the Brexit referendum, as the media reported several instances of “Leave” voters expressing regret over not having chosen to stay instead (Opinium Research, 2016). But is this specific to the Brexit referendum? Or do some people, in every election, come to the conclusion, ex post, that they did not make the right decision? These are the questions that are addressed in this study.

Data

In order to examine the extent to which citizens regret how they voted after Election Day and the factors that lead one individual to be more regretful than another, we rely on data from 11 elections in five different countries. Voters in Canada, France, Switzerland, Germany and Spain were asked ex post whether they thought that the decision they made to vote for a given party was a very good, fairly good, fairly bad, or very bad decision.

Results

First, as shown in Figure 1, we find that the majority of citizens have no regret (that is, they answer that they made a very good decision) when it comes to their vote choice. Indeed, French voters express the least regret, with 69% of respondents believing their choice to have been a very good one, followed by voters in Quebec and Ontario, with 67% and 61% respectively. In most of the European regions surveyed about 50% of citizens express no regret.

Capture d’écran 2016-07-07 à 13.40.26

Furthermore, the results suggest that the politically well informed are somewhat less regretful than the relatively poorly-informed. Similarly, those who voted ‘correctly’ tend to be less regretful. Voting correctly means casting a vote that reflects one’s preferences and which is coherent with one’s ideological position. Having voted correctly mitigates regret. Also, the effect of correct voting on regret is greater among the least informed.

Conclusion

This research aimed to assess whether political information and correct voting affect the extent to which citizens regret the choices they made on Election Day. We find that regret is less prevalent among the politically well-informed and those who vote correctly. However, more research needs to be done on what makes voters more or less satisfied with their personal decisions.

For more details, see

André Blais & Anja Kilibarda. Forthcoming. “Correct Voting and Post-Election Regret. “ PS: Political Science & Politics.

Posted in Blog | Comments closed

A new standard for evaluating the performance of electoral democracy

By André Blais, Eric Guntermann & Marc A. Bodet


What is the story?

We propose a simple and original standard for evaluating the performance of electoral democracies: the degree of correspondence between citizens’ party preferences and the party composition of the cabinet.


The criteria

We propose three criteria for assessing the correspondence between citizens’ party preferences and the party composition of governments that are formed after elections:

  • The proportion of citizens whose most preferred party is in government
  • Whether the party that is most liked overall is in government
  • How much more positively governing parties are rated than non-governing parties


The data

We use CSES data that include a party like/dislike question in which respondents are asked to rate each party on a 0-10 scale.

We focus on lower house elections in non-presidential democracies. Our sample includes 87 legislative elections held in 35 countries. We distinguish elections held under PR and under non-PR, and on the basis of disproportionality between vote and seat shares. For each party we compare its ratings in the electorate and the proportion of seats it had in the cabinet that was formed after the election.


Results

Criterion 1: How many citizens have their preferred party in government?

More people have their preferred party in government under PR, and this is due to the fact that PR leads to the presence of more parties in cabinet. As is shown in Graph 1 below, 50% of citizens, on average, get their most liked party in government under PR, compared with 43% in non-PR elections. On this first criterion, PR elections perform better.


Criterion 2: Is the most liked party in government?

We compute the mean ratings of all the parties in each election to identify the party that is most liked overall and determine whether that party is in government or not. The most liked party was in government after each of the ten non-PR elections, while that was not always the case following PR elections. Namely, in 11 PR elections out of 74 (15%), the most liked party found itself in the opposition. On this second criterion PR elections perform worse.

graph1

Criterion 3: Are governing parties better liked than non-governing parties?

Governing parties are better liked than opposition parties in 82 of the 87 elections. But the mean differential, as can be seen in Graph 2, is slightly more positive in non-PR elections. This is so because PR elections usually lead to the formation of coalition governments that often include at least one small party, and small parties are usually less liked than large parties. On this third criterion PR elections also perform worse.

graph2

Conclusion

Coalitions formed under PR lead to the inclusion of more citizens’ most liked parties in government (which is good) but they also allow small less liked parties to enter government (which is not so good). In short, before concluding that one system is better than the other we must decide which aspects of citizens’ preferences matter the most.

For more details, see André Blais, Eric Guntermann, and Marc André Bodet. Forthcoming. « Linking Party Preference and the Composition of Government : A New Standard for Evaluating the Performance of Electoral Democracy. » Political Science Research and Methods.

Posted in Blog | Comments closed

Do Citizens Feel Well Represented?

By Katherine V. R. Sullivan, Université de Montréal

What is the story?

Elections are designed to ensure that citizens’ views are taken into account by the political decision-makers. The hope is that voters will support the candidates/parties that represent their viewpoints and that as a consequence their views will have an indirect influence on the decisions that are made. But do citizens think that elections work as they should, that is, that the outcome of an election is a good reflection of public opinion? Do they feel that their views are well represented in the legislature?

Data

I examine feelings of representation across 27 elections within 5 countries (Switzerland, France, Spain, Germany and Canada) at the national, supra-national and sub-national levels by using data from the Making Electoral Democracy Work (MEDW) project.

I measure respondents’ feelings of representation by combining two survey questions. The first question “How well do you think your views are reflected in the legislature of the province/state/canton/country?” is on a scale from 0 (not at all) to 10 (totally). The second question, also on a scale from 0 (not accurate at all) to 10 (very accurate) goes as follows “How accurately do you think the outcome of the election reflects voters’ views?” I use the mean score given to these two questions.

Findings 

Table 1 shows that overall evaluations of representation tend to be slightly positive. The mean is above 5 in 19 cases and below the mid-point in only 8 instances. Voters were most positive with respect to the Bavaria national and regional elections, whereas judgments are most negative in the case of the European elections in Provence and Madrid.

Table 1: Mean score by election

Type

Mean

Bavaria national 6.20 (0.03)
Bavaria regional 6.15 (0.03)
Ontario national 6.01 (0.05)
British-Colombia National 5.88 (0.05)
Lucerne National 5.87 (0.06)
Zurich Regional 5.84 (0.06)
Lower Saxony Regional 5.81 (0.07)
Lucerne Regional 5.78 (0.05)
Lower Saxony National 5.69 (0.08)
Quebec National 5.58 (0.05)
Zurich national 5.48 (0.72)
Paris Municipal 5.45 (0.07)
IDF national 5.40 (0.07)
Lower Saxony Europe 5.23 (0.08)
Quebec regional 5.13 (0.07)
Provence national 5.09 (0.07)
Catalonia regional 5.08 (0.07)
Ontario regional 5.06 (0.07)
Bavaria Europe 5.00 (0.04)
Marseille municipal 4.96 (0.09)
Madrid Regional 4.94 (0.07)
Catalonia Europe 4.81 (0.07)
IDF Europe 4.70 (0.07)
Madrid National 4.67 (0.08)
Catalonia national 4.52 (0.07)
Provence Europe 4.51 (0.07)
Madrid Europe 4.34 (0.07)

Standard deviation presented in parentheses

Table 2 indicates that the Swiss and German electorates have the most positive perceptions and Spaniards the most negative.

Table 2: Mean score by country

Country

Mean

Switzerland 5.90 (0.03)
Germany 5.87 (0.02)
Canada 5.62 (0.03)
France 5.02 (0.03)
Spain 4.73 (0.03)

Standard deviation presented in parentheses

Finally, Table 3 shows that citizens tend to be more positive overall about representation at the national and sub-national level and feel more negative about the supra-national level.

Table 3: Mean score by level

Level

Mean

National 5.73 (0.02)
Sub-national 5.67 (0.02)
Supranational 4.82 (0.25)

Standard deviation presented in parentheses

Conclusion

All in all citizens from Switzerland, Germany and Canada have slightly positive views about the representative process while Spaniards are slightly negative. Judgments do not differ between the national and the subnational levels but Europeans are somewhat negative about the European level.

Posted in Blog | Comments closed

Democracy and football

By Ignacio Lago, Univesitat Pompeu Fabra, Barcelona *

The influence of politics on sports and more specifically on football (soccer) has been widely discussed, but no hard empirical evidence can be found in political science, economics or sports science research. We fill this gap by examining whether the competitive balance in football domestic leagues (i.e. the extent to which certain clubs dominate the domestic league) is affected by the country’s political regime, We rely on data from two samples of 47 and 49 European countries from 1950 through 2011 and 1,980 and 1,960 football domestic leagues, respectively,

We argue that domestic leagues are more heavily dominated by the same club in non-democratic regimes than in democracies. Democratic transitions trigger pressures to increase the competitive balance within football domestic leagues in two ways. First, the political manipulation of football decreases with democratization. The link between non- democratic regimes and specific teams, particularly evident in communist countries, breaks when a country experiences a transition to democracy. Secondly, at the same time, with the onset of democracy, capitalist modus operandi are progressively adopted by clubs and football then starts to operate as a market free of price restrictions with no salary caps or draft rights. The economic liberalization that takes place in transitions to democracy disperses resources that undermine the monopolistic dominance of certain teams supported by non-democracies and generates competition among descending and ascending teams.

The first piece of evidence supporting the argument that political regimes affect football domestic leagues is displayed in Figure 1. The relationship between the percentage of domestic leagues won by the most successful club in each country and the number of leagues played under democracy is displayed. As can be seen the competitive balance of football domestic leagues is positively correlated with the length of democracy. The average value of Winner in democracies, 40.75, is substantially lower than in non-democracies, 48.36.

In a second analysis, we examine the competitiveness of domestic leagues in the 13 countries which have experienced a transition to democracy after 1950. In all of them, not one of the most successful clubs during the non-democratic period has been the most successful club after democratization. More specifically, for the most successful club in the non-democratic period, winning the previous league significantly increases the probability of winning the league the next year when the country is not a democracy. However, when the country is a democracy, being the winner of the previous league does not affect its probability of winning the current year. In other words, when countries experience a transition to democracy, dominant clubs in the non-democratic period become weaker competitors.

Figure 1: Winners in football domestic leagues in democracies and non-democracies

winners in football

Ignacio Lago, Universitat Pompeu Fabra and GEN
Carlos Lago-Peñas, GEN (University of Vigo)
Santiago Lago-Peñas, GEN (University of Vigo)
“Democracy and Football”, Social Science Quarterly, 2016 (early view)

Posted in Blog | Comments closed

Is Duverger’s Law Valid?

By André Blais, Université de Montréal*

I examine Duverger’s law according to which « the plurality rule leads to a two party system. » I am interested in the party system at the electoral level, that is, the distribution of votes among the parties. Even though I show that the contemporary evidence tends to disconfirm Duverger’s law, I argue that the basic intuition behind the law is valid.

Duverger predicted that only two parties or candidates would receive a significant degree of support as voters do not want to waste their vote on candidates with little or no chance of winning. This of course assumes that they are short-term utility maximizers and are well informed about the chances of the various candidates.

I examine the outcome of the most recent elections in the three established democracies that use SMP: Britain, Canada, and the United States. I simply count the number of candidates with some minimally meaningful level of support, that is, with at least 5% of the vote.

Table 1 shows the distribution of the number of candidates with at least 5% of the votes in the most recent American (Congressional), British, and Canadian elections. The results are clear. In the U.S. the results almost perfectly support Duverger. There are only two ‘serious’ candidates in 94% of the districts. Things are quite different in Britain and Canada. In both countries, there are only two ‘serious’ candidates in less than 5% of the cases. The most typical situation is to have three candidates with at least 5% of the vote. There are ten times as many cases of four candidates (with at least 5% of the vote) than of two candidates in Canada and twenty times as many in Britain. Hence, Duverger’s law is disconfirmed in Britain and Canada.

Capture d’écran 2016-03-08 à 10.17.27

I conclude that Duverger’s claim that SMP leads to a two-party system is wrong but that he is absolutely right in arguing that under first past the post a significant number of voters desert their preferred party when it is not viable and that this leads to a less fragmented party system.

André Blais, “Is Duverger’s law valid?” French Politics (forthcoming).

References

Blais, André. 2002. ”Why Is there So Little Strategic Voting in Canadian Plurality Rule Elections?” Political Studies 50: 445-454.

Blais, A. 2013. “Evaluating U.S. Electoral Institutions in Comparative Perspective.” In Representation: Elections and Beyond. J.H. Nagel and R.S. Smith (ed.)) Oxford: Oxford University Press.

Blais, A. and R. K. Carty. 1991. ”The Psychological Impact of Electoral Laws: Measuring Duverger’s Elusive Factor. ” British Journal of Political Science 21: 79-93.

Blais, A and P. Loewen. 2009. “The Electoral System and its Effects.” West European Politics 34: 342-356.

Clark, W., and Golder, M. 2006. ”Rehabilitating Duverger’s law: Testing the Mechanical and Strategic Modifying Effects of Electoral Laws.” Comparative Political Studies 39: 679-708.

Cox, G.W. 1997. Making Votes Count. Strategic Coordination in the World’s Electoral Systems. Cambridge: Cambridge University Press.

Downs, A. 1957. An Economic Theory of Democracy. New York: Harper Collins   Publishers.

Duverger, M. 1951. Les partis politiques. Paris: Colin.

Gunther, R. 1989. “Electoral Laws, Party Sysrtems, and Elites: The Case of Spain.” American Political Science Review 83: 835-858.

Lago, I. and J. R.  Montero. 2009. ”Coordination among Arenas in Multi-Level Countries.” European Journal of Political Research 48: 176-203.

Taagepera, R. and M.S. Shugart. 1989. Seats and Votes. New Haven: Yale University Press.

Posted in Blog | Comments closed

How to reform European elections?

By Damien Bol, King’s College London

What is the story?

The EU is at a critical moment in its development. Many citizens express a negative attitude towards European integration and do not trust European decision makers. A proposal that has been put forward to mitigate this problem, and to help European representatives gain the confidence of the population, is to create a pan-European district in which a small number of MEPs would be elected.

In a recent paper we evaluated this proposal via a unique online experiment where we invited thousands of Europeans to report how they would vote in a pan-European ballot. We find that vote choice in a pan-European district would be substantially affected by the presence of national candidates on the lists. We discuss the implications of our findings and derive some recommandations for European decision makers.

The EuroVotePlus experiment

In the three weeks preceding the 2014 EP election, we conducted an online experiment (for a discussion of the details of this experiment, see this other paper). We created a multi-lingual website, open to all, where users were invited to learn more about European elections in general and the rules used to elect MEPs and to participate in an online voting experiment.

In the experimental part of the website, we invited people to indicate their vote preference in the upcoming European election using the party lists utilized in their district. We also asked all participants, regardless of their country, to indicate how they would vote if 10 additional members of the European Parliament were to be elected in a pan-European district. We simulated a pan-European ballot by creating party lists based on the existing political groups in the European Parliament. We randomly picked, for each respondent, 10 incumbent MEPs from each political group. A screenshot of a pan-European ballot is presented below. The ballot contained the name of the candidate, his/her nationality, and a picture.

figure_DAMIEN

Findings

In the pan-European ballot, people were invited to cast a vote under different electoral rules. We first asked them to cast a vote under closed-list proportional representation for which they could only choose one list. Even if the participants appeared to be ideologically driven, as they voted massively for the pan-European list corresponding to the party they had the intention to vote for in the national ballot, they were strongly affected by the nationality of the candidates appearing on the list. They were 48% times more likely to vote for a list when there was a least one candidate of their country.

We also asked them to vote under open-list proportional representation for which they could choose one list and give extra points to individual candidates of this list. The effects were similar to those observed under closed-list proportion representation, but we observed that the participants were 8 times more likely to give a positive point to candidates of their own nationality.

Recommandations

We derive two concrete recommendations for EU decision makers. First, if a pan-European district is created, we recommend establishing a maximum number of candidates from each EU country on the lists. If this number is not fixed, pan-European parties, anticipating the effect of the nationality of candidates on vote choice, would be likely to nominate candidates from large countries.

Second, if a pan-European district is created, the argument developed in this article lends support to the implementation of a closed-list PR system, instead of an open-list PR system. Since we find that Europeans would give more positive votes to national candidates, the open-list PR system would also lead to the domination of the pan-European seats by large countries.

All in all, although we see the great potential of creating a pan-European district to reduce the EU democratic deficit, we recommend being cautious in setting the precise rules for this election.

For more details, see Damien Bol, Philipp Harfst, André Blais, Sona Golder, Jean-François Laslier, Laura Stephenson, and Karine Van der Straeten. “Addressing Europe’s Democratic Deficit: An Experimental Evaluation of the Pan-European District Proposal.” European Union Politics.

Posted in Blog | Comments closed

Strategic Voting

By Jean-François Daoust (Université de Montréal) and Damien Bol (King’s College London)

What Is The Story?

The concept of strategic voting is widely used by political parties and the media. It is assumed to be a widespread behaviour because Canada has a “winner-takes-all” electoral system. But what is the actual proportion of strategic votes?
To tackle this question, we need to define rigorously what a strategic vote is. There are two very simple conditions for a vote to be qualified as strategic: first, a voter must not vote for her preferred party, and second, she must do so because her preferred party has little or no chance of winning.in her constituency.

Data

Data from the Making Electoral Democracy Work (MEDW) surveys are well suited to analyse the extent to which people vote strategically as they provide indicators of individual preferences, expectations about the various parties’ chances of winning in the respondent’s constituency, and vote choice.
Preferences were tapped by asking people how much they like each party on a scale from zero to ten (from ‘really dislike’ to ‘really like’). For expectations, respondents were asked to evaluate the chances of the various parties winning in their constituency, also on a scale from zero to ten (from ‘no chance at all’ to ‘certain to win’). Finally, vote choice is measured by a self-reported answer in the post-electoral wave.

We use data from two provincial elections and the last federal election.

The Method

The method has two steps. First, we identify respondents who were potential strategic voters, i.e. those whose preferred party was not one of the top two contenders (the two parties perceived to have the highest chances of winning) in their constituency. Second, we identify within this subgroup of potential strategic voters those who voted for their most preferred party among the top two contenders. These voters casted, following our definition, a strategic vote.

Results

Table 1 displays the extent to which Canadians voted strategically.


tableau_blogue

Note: Entries are non-weighted proportions. Weighted proportions using actual results for each political party are into parentheses.

Firstly, less than one fifth of the electorate had incentives to cast a strategic vote (i.e. were potential strategic voters). Among those who did have incentives to do so, around 40% desert strategically. At the end of the day, around 8% of Canadians voted strategically in the three largest provinces in the last federal election. We see a relatively substantial increase in Ontario (compared with the provincial election). There appears to be a slight decrease in Quebec.

Conclusion

Measuring strategic voting requires indicators of preferences, expectations and vote choice. In order to ascertain how many citizens act strategically in an election, we must focus on the subgroup of voters with incentives to vote strategically and then analyse if they desert their preferred option in favour of the most preferred party between the top two contenders in their constituency. When we do so, we find that about 20% of voters face a situation where they have to decide whether to vote strategically or not and that about 20% of them (and 8% of all the voters) cast a strategic vote.

Posted in Blog | Comments closed

The evolution of vote intentions during the 2015 Canadian election campaign

By André Blais and Jean-Michel Lavoie
Université de Montréal

Campaign dynamics

Support for the Conservatives remains remarkably stable during the whole campaign, hovering between 28% and 32%. The Conservatives reached their bottom, at 27%, in late August, possibly because of the Duffy trial. The drop in Conservative support is observed only in Ontario, where Conservative vote intentions decrease from about 37% before the appearance of Wright (August 12) to about 27% by the end of the month. By mid-September the Conservatives were back to about 33% nationally, suggesting that the impact of the Duffy trial had gradually evaporated.
For the rest of the campaign the Conservatives remain at slightly above 30%, with little movement. There is some shift in Quebec, however, as their support increases in the second half of September. Note that the Conservatives also made some gain in British Columbia during the campaign.
Things are quite different for the Liberals. They start at about 27% and end at 38%, an increase of about 10 points. There is a small increase in Liberal support in late August, which is most apparent in Ontario, from about 27% to about 30%, possibly related to the Duffy trial. Liberal support stays at about 30% for the whole month of September. Liberal vote intentions more or less constantly and progressively rise throughout October.
NDP support, for its part, stays around 32% from the start of the campaign to mid-September. This is followed by a very gradual and constant decline throughout the last five weeks of the campaign.

The niqab issue

The big question is whether the NDP decline was the result of the niqab issue. If so, we should observe that the NDP drop was strongest in Quebec since this is where the issue was most strongly debated. That seems to be the case: support for the NDP in Quebec went from about 43% in mid-September to about 25% by election day.
In order to conclude that the niqab issue was the crucial factor in the NDP decline, we would also have to observe that the decline started earlier in Quebec. That seems to be the case as well. The NDP descent in Quebec starts around September 18, which is the day the Conservatives announced their appeal; the party’s descent in Ontario begins only in early October. The evidence suggests that the niqab had a big influence in Quebec, producing a drop of about 10 points for the NDP in late September. Logically, that loss should have been to the benefit of the Conservatives and the Bloc, which were taking an anti-niqab stance. Is it the case? The party that makes the biggest gain in Quebec during that period is the Bloc (from 14% to 20%).

The Liberal surge in October

The last question is: How can we explain the NDP’s continuous decline throughout October, to the benefit of the Liberals? The fact that the movement is very gradual suggests that this is not due to any specific crucial event.
One interpretation is that many voters, especially in Ontario, abandoned the NDP for the Liberals as it became obvious that only the latter could defeat the Conservatives. We cannot directly test that interpretation with these data. We observe, however, that the Liberal gains in Ontario during the month of October come at the expense of the Conservatives as well as of the NDP, which suggests that it was simply the image of the Liberal party and of Justin Trudeau that was constantly improving in the last three weeks of the campaign.

Conclusion

Two major conclusions can be drawn from this analysis. First, specific campaign events do not seem to account for most of the campaign dynamics. The Liberal gains and the NDP losses appear to be mostly gradual, as if Canadians came to like the Liberals a little bit more and the NDP a little bit less as the campaign progressed. The Duffy trial had a temporary effect in Ontario but that is all. There is no trace of any significant shift after any of the leaders’ debates or after the Liberals’ announcement, on August 27, that they would run a deficit if elected, or when the story broke about the drowned Syrian boy (September 2). The only exception is the niqab affair, which had a big impact in Quebec, to the detriment of the NDP.
The second conclusion is that while the Liberals gained ground and the NDP declined during the campaign in each of the three provinces, there were substantial differences in campaign dynamics across the provinces. The shifts were strongest and most gradual in Ontario. In Quebec, the Conservatives and the Bloc also made some modest gains when the NDP support began to tumble. And in BC, the Liberal surge was particularly modest and late.
NB: We thank Claire Durand for sharing the poll data. We thank her and Laura Stephenson for comments on a previous draft.

Figures 1 to 13 present the evolution of vote intentions during the 2015 Canadian election campaign, starting August 2, until October 18, the day before the election.
Daily estimates correspond to the mean of all the polls that were in the field that day.

figure 1

graph1

figure 2

graph2

figure 3

graph3

figure 4

graph4

figure 5

graph5

figure 6

graph6

figure 7

graph7

figure 8

grpah8

figure 9

graph9

figure 10

graph10

figure 11

graph11

figure 12

graph12

figure 13

graph13

Posted in Blog | Comments closed

The formation of a new government in Catalonia

By Marc Guinjoan

The former Catalan PM, Artur Mas (left), shaking hands with the newly elected PM Carles Puigdemont (right) in the Parliament on Sunday.

The last Catalan regional elections took place on September 27th 2015. The Catalan government, led by Prime Minister Artur Mas of the center-right nationalist Convergència i Unió (CiU), called early elections after having been unable to convince the Spanish government to hold a referendum on secession in Catalonia. Before the elections took place, the coalition composed of CiU and Convergència Democràtica de Catalunya (CDC) was dissolved. The main (pro-secession) faction within CiU formed an electoral coalition (joint list) with the left-wing secessionist party Esquerra Republicana de Catalunya (ERC). The joint list was called Junts pel Sí (JxS, Together for the Yes).
JxS won the September 27th elections, with 62 deputies elected out of 135. The extreme left-wing secessionist Candidatura d’Unitat Popular (CUP) managed to have 10 deputies elected. Together the secessionist parties had 72 deputies, and thus a majority of seats, against 63 for the anti-secessionist parties, as shown in the graph below.
In order to be re-elected PM, Artur Mas could count on the support of the 62 deputies elected under the JxS list, and on the opposition of the 63 deputies from the anti-secessionist parties. This means that he also needed some support from the extreme left secessionist CUP. But during the campaign the CUP had promised not to support Artur Mas because of his austerity measures. So the question was whether Mas, or someone else, could obtain majority support or not. The parties had until January 10 to come to a deal. According to the Constitution, new elections would be automatically called if no candidate had managed to get majority support by that date.

graph_catalogne

The negotiations between JxS and the CUP lasted several months, and appeared to have ended in a deadlock. After several CUP activist assemblies, including a 1515 vs 1515 vote draw in a massive assembly, the CUP finally announced that it would not support Mas, on January 3, one week before the deadline. The party indicated that it was willing to join the secessionist coalition only if JxS came up with another candidate. As the JxS reiterated its support for Mas, everyone was getting prepared for a new election.
And then, at the very last minute, Artur Mas announced that he had decided not to run as PM, and proposed a new candidate from CDC, Carles Puigdemont, the (now former) mayor of Girona. In short the CDC accepted the condition imposed by the extreme left-wing CUP. In return CUP allowed two of its deputies to vote for Carles Puigdemont (and the other eight abstained). That vote, which occurred just two hours before the deadline, led to the election of Puigdemont as PM and the formation of a secessionist government in Catalonia.
In short the small CUP, with only 10 deputies, eventually managed to impose its condition to the JxS, with 62 deputies. CUP was successful because JxS was concerned that the possibility of not electing a president in an election labelled as a “plebiscite” on Catalan independence would lead to frustration among its supporters. Additionally, although JxS would have probably obtained similar results if new elections had been held, CUP would probably have lost ground, thus complicating the achievement of a majority in favour of secession. In sum, Mas’ last minute resignation allowed CDC to continue holding the position of PM in Catalonia, and represented a powerful but exclusively symbolic gain for the CUP, since there is no indication that the new PM is more leftist than the one who was forced to resign. It remains to be seen who are the long-term winners and losers.

Posted in Blog | Comments closed